Infográfico desenvolvido para o INPUT a partir do relatório completo. Foi desenvolvido o projeto gráfico, ilustrações, gráficos, tratamento de imagens.
O desafio aqui foi sintetizar todas as informações e criar uma hierarquia da informação lógica, priorizando a mensagem.
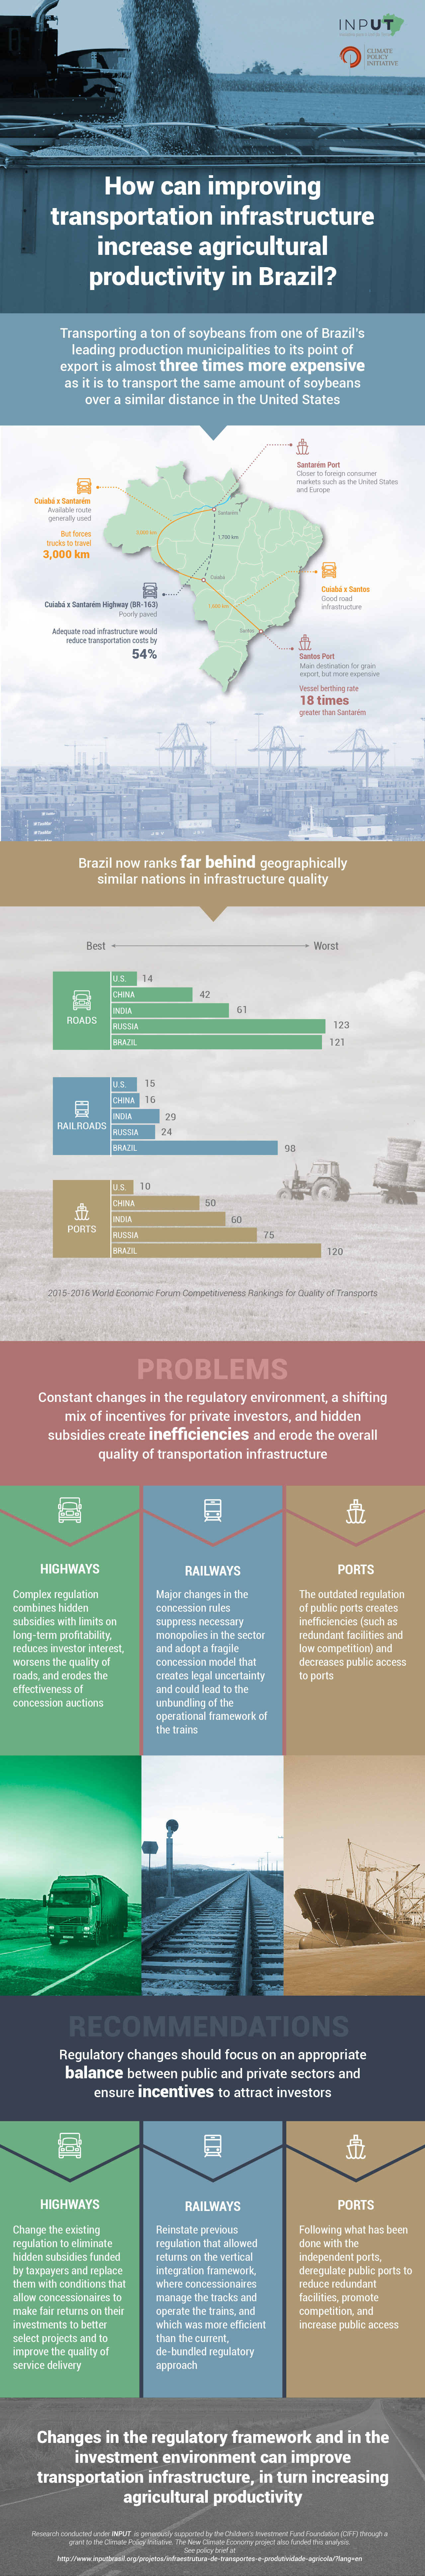
Infographic
Infographic developed for INPUT (Land Use Initiative)
Infographic developed for INPUT based on the full report. The graphic design, illustrations, graphics and image processing were developed.
The challenge was to synthesize all the information and create a logical hierarchy of information, prioritizing the message.

Versão em inglês (English version)